Главный Хит в Маркете! Все отзывы - 5 звёзд!!! Торгует на реальных счетах.
Buy PA TRADE Expert Advisor in the store selling algo trading systems

SuperHit in the Market! All the reviews are 5 stars!!! Trading on real accounts.
Buy PA TRADE Expert Advisor in the store selling algo trading systems

Tuesday 17 March 2015

The Japanese yen is trying to strengthen

On Tuesday morning, the USD/JPY pair is attempting to move away from local maximums after the decisions of the Bank of Japan.

The Japanese yen is trying to move away from the lows of recent weeks after the March meeting of the Bank of Japan. The regulator decided to keep the key monetary policy unchanged. The money supply will grow by 80 trillion yen annually, the solution agreed by eight votes "for" and one "against". The inflation target remains the same - 2%, but is delayed for a longer term.

According to the comments from the BoJ, the Japanese economy will recover at a moderate pace. Inflation, which is the main CPI, will remain in the range of 0-0.5%. The main consumer price inflation will tend to zero.

Fibonacci Retracements Analysis 17.03.2015 (EUR/USD, EUR/GBP)

Analysis for March 17th, 2015

EUR USD, “Euro vs US Dollar”

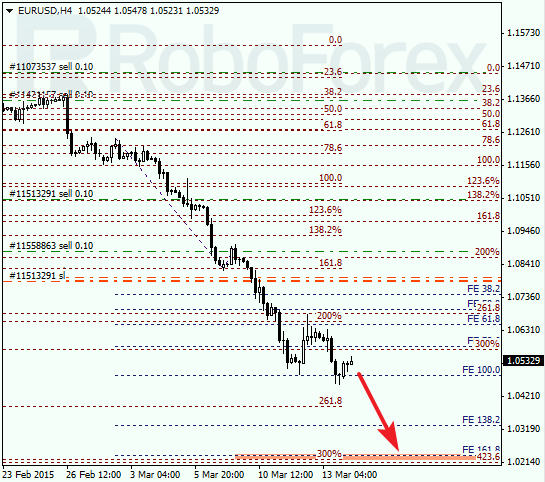
Eurodollar is being corrected. Probably, later the price may continue falling towards the next group of fibo-levels at 1.0220. After reaching them, the market may start a larger ascending correction.


As we can see at the H1 chart, the lower target area is confirmed by local retracements. I’m planning to open another sell order with the stop loss at a local high when the market rebounds from a correctional retracement 61.8%.

Murrey Math Lines 17.03.2015 (EUR/USD, USD/CAD)

Analysis for March 17th, 2015

EUR USD, “Euro vs US Dollar”

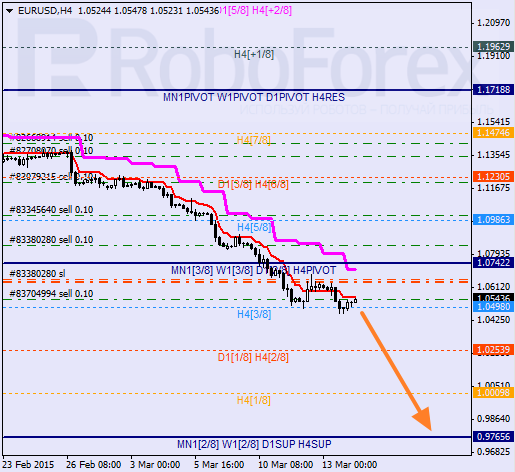
Eurodollar is being corrected between Super Trends. If the pair is able to stay below the 3/8 level, bears will continue pushing the price towards the 0/8 one. Possibly, in the nearest future the price may reach a new low.


As we can see at the H1 chart, Super Trends have formed “bullish cross” during the correction. if the price rebounds from the 3/8 level once again, the target will be at the 0/8 one. I’ve opened an additional sell order during a local correction.

Forex Technical Analysis 17.03.2015 (EUR/USD, GBP/USD, USD/CHF, USD/JPY, AUD/USD, USD/RUB, GOLD)

Analysis for March 17th, 2015

EUR USD, “Euro vs US Dollar”

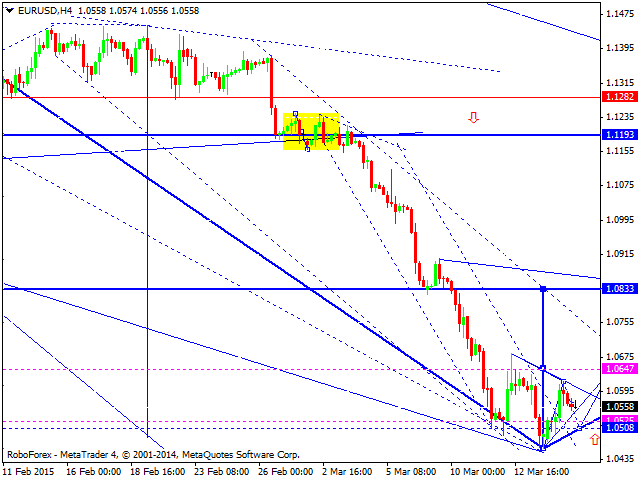
Eurodollar has finished an ascending impulse with an extension and right now is correcting it. We think, today the price may form a consolidation channel by falling to reach level of 1.0510. If the market breaks this channel upwards, it may start a correction. The target of this wave is at level of 1.0833.


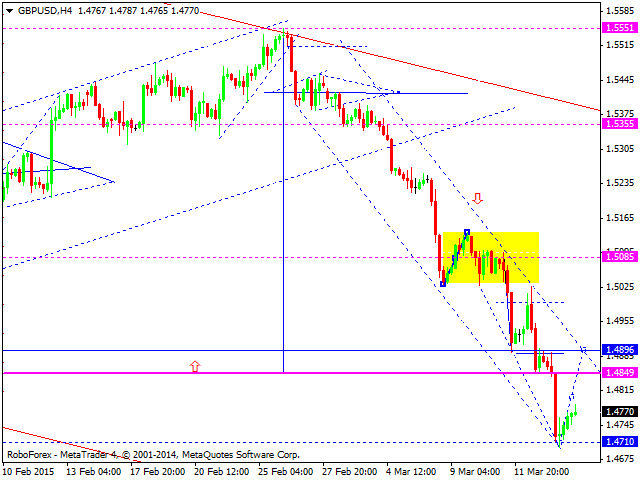
GBP USD, “Great Britain Pound vs US Dollar”

Wave Analysis 17.03.2015 (EUR/USD, GBP/USD, USD/JPY, USD/CAD)

Analysis for March 17th, 2015

EUR USD, “Euro vs US Dollar”

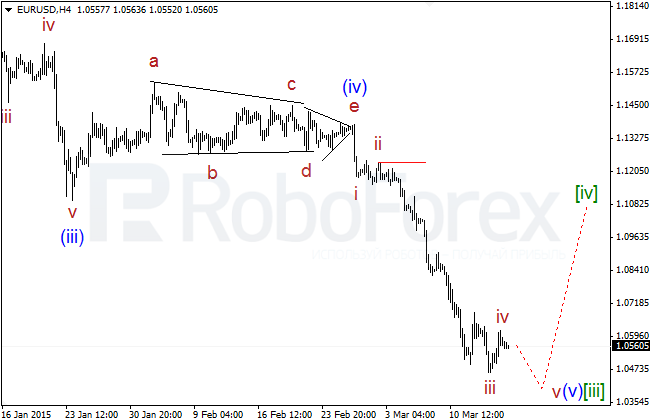
The market continues forming a descending impulse (v) of [iii] with a double extension inside it. In the nearest future Euro is expected to continue falling and complete this whole structure.


Probably, the price has finished wave iv of (v) of [iii]. In the nearest future, the market is expected to reach a new local low and stay below 1.0450.

Ichimoku Cloud Analysis 17.03.2015 (GBP/USD, GOLD)

Analysis for March 17th, 2015

GBP USD, “Great Britain Pound vs US Dollar”

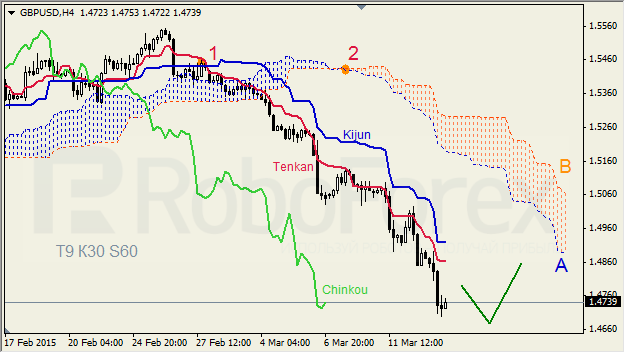
GBP USD, Time Frame H4. Tenkan-Sen and Kijun-Sen are influenced by “Dead Cross” (1). Chinkou Lagging Span is below the chart, Ichimoku Cloud is going down (2), and the price is below Tenkan-Sen. Short-term forecast: we can expect resistance from Kijun-Sen.


GBP USD, Time Frame H1. Tenkan-Sen and Kijun-Sen intersected below Kumo Cloud and formed “Golden Cross” (1). Chinkou Lagging Span is on the chart, Ichimoku Cloud is heading down, and the price is between Tenkan-Sen and Kijun-Sen. Short-term forecast: we can expect resistance from Tenkan-Sen – Senkou Span A, support from Kijun-Sen, and attempts of the price to stay inside the cloud.

Japanese Candlesticks Analysis 17.03.2015 (EUR/USD, USD/JPY)

Analysis for March 17th, 2015

EUR USD, “Euro vs. US Dollar”

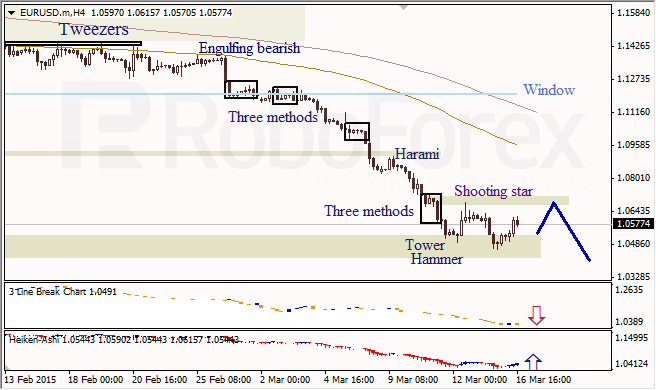
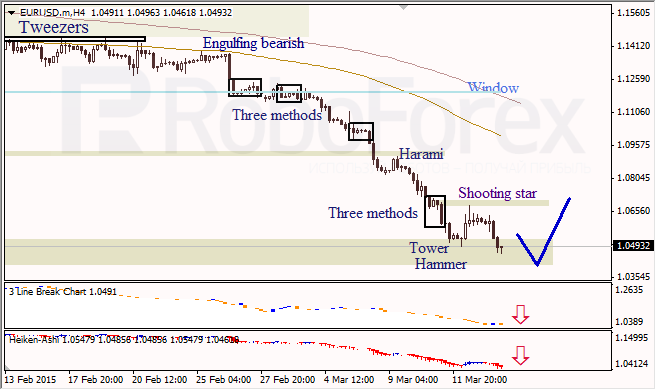
The H4 chart of EUR USD shows a correction within the downtrend. Three Line Break chart indicates the downtrend; Heiken Ashi candlesticks confirm that the correction continues.


At the H1 chart of EUR USD, Morning Star pattern indicates that the correction continues. Three Line Break chart shows the downtrend; Heiken Ashi candlesticks confirm an ascending correction.

Monday 16 March 2015

The euro has temporarily stabilized

On Monday morning the main currency pair remains neutral, but for how long? This week, the Federal Reserve will once again confirm its monetary steps, and new lows are not far off.

The euro/dollar on Monday morning is even trading with a symbolic increase, if it can be called a small deviation from the twelve-year lows.

There will not be much statistics today: the United States will present data on the index of manufacturing activity from the Federal Reserve Bank of New York in February, and later on the industrial production figures for last month will be released. In the afternoon, the head of the European Central Bank Mario Draghi will deliver a speech.

Forex Technical Analysis 16.03.2015 (EUR/USD, GBP/USD, USD/CHF, USD/JPY, AUD/USD, USD/RUB, GOLD)

Analysis for March 16th, 2015

EUR USD, “Euro vs US Dollar”

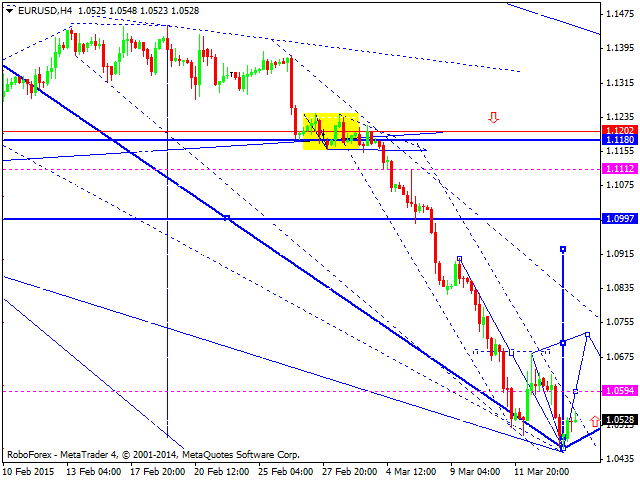
Eurodollar is attempting to form a consolidation range and an ascending impulse towards its upper border. Right now, this impulse isn’t strong enough to continue. We think, today the price may reach a new low.


GBP USD, “Great Britain Pound vs US Dollar”

Pound is trying to form an ascending impulse. We think, today the price may grow towards the upper border of the current consolidation channel and then fall to reach the lower one.


USD CHF, “US Dollar vs Swiss Franc”

Wave Analysis 16.03.2015 (EUR/USD, GBP/USD, USD/JPY, USD/CAD)

Analysis for March 16th, 2015

EUR USD, “Euro vs US Dollar”

The market continues forming a large descending impulse inside wave (v) of [iii]. Most likely, in the nearest future Euro may form a horizontal correction inside wave iv of (v) of [iii].


I’ve turned to a more bearish scenario, which implies that the price is forming a double extension inside waveiii of (v) of [iii]. In the nearest future, the market is expected to form a correction inside wave iv of (v) of [iii].

Fibonacci Retracements Analysis 16.03.2015 (EUR/USD, EUR/GBP)

Analysis for March 16th, 2015

EUR USD, “Euro vs US Dollar”

Eurodollar is being corrected. Probably, later the price may continue falling towards the next group of fibo-levels at 1.0220. After reaching them, the market may start a larger ascending correction.


As we can see at the H1 chart, the lower target area is confirmed by local retracements. I’m planning to open another sell order with the stop loss at a local high when the market rebounds from a correctional retracement 38.2%.

Murrey Math Lines 16.03.2015 (EUR/USD, USD/CAD)

Analysis for March 16th, 2015

EUR USD, “Euro vs US Dollar”

Eurodollar is trying to stay below the 3/8 level and allow bears to continue pushing the price towards the 0/8one. The pair is supported by Super Trends. Possibly, in the nearest future the price may reach a new low.


At the H1 chart, last Friday Super Trends formed “bearish cross”. Considering that earlier the price had been able to stay below the 3/8 level. The next target will be at the 0/8 one. I’ve opened an additional sell order during a local correction.

Ichimoku Cloud Analysis 16.03.2015 (GBP/USD, GOLD)

Analysis for March 16th, 2015

GBP USD, “Great Britain Pound vs US Dollar”

GBP USD, Time Frame H4. Tenkan-Sen and Kijun-Sen are influenced by “Dead Cross” (1). Chinkou Lagging Span is below the chart, Ichimoku Cloud is going down (2), and the price is still below the lines. Short-term forecast: we can expect decline of the price and then a correction towards the cloud’s lower border.


GBP USD, Time Frame H1. Tenkan-Sen and Kijun-Sen are close to each other and still influenced by “Dead Cross” (1). Chinkou Lagging Span is below the chart, Ichimoku Cloud is heading down, and the price is below the lines. Short-term forecast: we can expect resistance from Kijun-Sen, and decline of the price.

Japanese Candlesticks Analysis 16.03.2015 (EUR/USD, USD/JPY)

Analysis for March 16th, 2015

EUR USD, “Euro vs. US Dollar”

As we can see at the H4 chart of EUR USD, the downtrend continues. The price has reached more than 10 lows at the daily chart, which means that the market may start a correction soon. Three Line Break chart and Heiken Ashi candlesticks indicate a bearish movement.


The H1 chart of EUR USD also shows the downtrend. Morning Star pattern indicates a possible correction. Three Line Break chart and Heiken Ashi candlesticks indicate a descending movement.

Wednesday 4 March 2015

The British pound is pulling down

On Wednesday, the GBP/USD pair is trading down: the pound came under pressure from statistics and still can not find support.

The British Pound midweek traded downward. Pressure on the GBP was formed after a two month peak of 1.5551 for the pair. Whether investors considered the instrument overbought, or it was just time for a technical correction.

In addition, today's statistics were not very impressive. UK service sector at the end of February slowed its growth. The index of business activity in the services sector in the UK in February retreated to the level of 56.7 points against the forecast of growth to 57.6 points. In the components of the report it is noticeable that the level of wages has increased, and performance on new orders has improved.

This week the euro is "almost exhausted"

Since the start of the week the main currency pair almost did not move - apparently, investors are saving energy before the statistics come out.

The block of statistical data on the United States scheduled for the end of the week, which includes the important February reports on the employment market, has left the investors in suspense. In this case, the news that is coming out produce almost no impression on the market participants – so, just an acceptance of fact.

Yesterday the head of the US Federal Reserve Janet Yellen said that the regulator is seriously busy working on regulations that protect the banking industry from a takeover. Most likely, the monetary policy meant the takeover of a regulatory nature. Measures should be averaged at the same time on the requirements for the size of the bank, its risks and the time of integration into the global banking system.

Ichimoku Cloud Analysis 04.03.2015 (GBP/USD, GOLD)

Analysis for March 4th, 2015

GBP USD, “Great Britain Pound vs US Dollar”

GBP USD, Time Frame H4. Tenkan-Sen and Kijun-Sen are influenced by “Dead Cross” (1). Chinkou Lagging Span is below the chart, and Ichimoku Cloud is going down (2). Short-term forecast: we can expect resistance from D Senkou Span B, and decline of the price.


GBP USD, Time Frame H1. Tenkan-Sen and Kijun-Sen formed “Dead Cross” (1) below Kumo Cloud. Chinkou Lagging Span is below the chart, Ichimoku Cloud is heading down (2), and the price is between Tenkan-Sen and Kijun-Sen. Short-term forecast: we can expect resistance from Senkou Span B, and decline of the price.

Japanese Candlesticks Analysis 04.03.2015 (EUR/USD, USD/JPY)

Analysis for March 4th, 2015

EUR USD, “Euro vs. US Dollar”

The H4 chart of EUR USD shows a sideways correction within the downtrend. Three Methods continuation pattern is a resistance level. Three Line Break chart and Heiken Ashi candlesticks confirm that the downtrend continues.


As we can see at the H1 chart of EUR USD, the price is being corrected inside the lower Window. Three Line Break chart confirms a descending movement; Heiken Ashi candlesticks indicate that an ascending correction may continue.

Fibonacci Retracements Analysis 04.03.2015 (EUR/USD, EUR/GBP)

Analysis for March 4th, 2015

EUR USD, “Euro vs US Dollar”

After rebounding from the upper fibo-levels several times, Eurodollar continues falling. The closest target for bears is the group of fibo-levels at 1.0940. I’m planning to stop trading after the pair reaches the above-mentioned area.


As we can see at the H1 chart, the pair has rebounded from a local retracement 38.2%. Earlier I opened an additional sell order and moved the stop losses on my previous ones a bit lower. Possibly, the market may reach its lower targets in the nearest future.

Forex Technical Analysis 04.03.2015 (EUR/USD, GBP/USD, USD/CHF, USD/JPY, AUD/USD, USD/RUB, GOLD)

Analysis for March 4th, 2015

EUR USD, “Euro vs US Dollar”

Eurodollar is under pressure and continues falling. We think, today the price may break the minimum and reach level of 1.1100. After that, the pair may form a correction to return to level of 1.1270 and then continue moving inside the downtrend towards level of 1.1000.


GBP USD, “Great Britain Pound vs US Dollar”

Pound continues falling. We think, today the price may reach level of 1.5280 and then return to level of 1.5370. After that, the pair may form another descending structure with the target at level of 1.5260.

Murrey Math Lines 04.03.2015 (EUR/USD, NZD/JPY)

Analysis for March 4th, 2015

EUR USD, “Euro vs US Dollar”

Euro is moving near its local lows. The price has broken the 4/8 level and stayed below it, and if later bears are able to stay below the 3/8 level, the market may continue falling towards the 1/8 one.


As we can see at the H1 chart, after breaking the 0/8 level, the pair is moving inside “oversold zone”. Earlier during a local correction, I opened an additional sell order. In the future, the price may break the -2/8 level. In this case, the lines at the chart will be redrawn.

Wave Analysis 04.03.2015 (EUR/USD, GBP/USD, USD/JPY, USD/CAD)

Analysis for March 4th, 2015

EUR USD, “Euro vs US Dollar”

In case of Euro, the situation hasn’t changed much over the last 24 hours. The price is still forming a descending impulse inside wave (v) of [iii]. Most likely, in the nearest future, the market is expected to stay below 1.1100.


The descending movement of the price over the last 24 hours has been quite weak. Nevertheless, in the nearest future, the market is expected to stay below the confirming level at 1.1158 and continue falling inside wave (v) of [iii].

Tuesday 3 March 2015

Fibonacci Retracements Analysis 03.03.2015 (EUR/USD, EUR/GBP)

Analysis for March 3rd, 2015

EUR USD, “Euro vs US Dollar”

After rebounding from the upper fibo-levels several times, Eurodollar resumed falling. The closest target for bears is the group of fibo-levels at 1.0940. I’m planning to stop trading after the pair reaches the above-mentioned area.


At the H1 chart, yesterday the pair rebounded from a local retracement 38.2%. Earlier I’d opened an additional sell order and moved the stop losses on my previous ones a bit lower. Possibly, the market may reach its lower targets in the nearest future.

Murrey Math Lines 03.03.2015 (EUR/USD, USD/CAD)

Analysis for March 3rd, 2015

EUR USD, “Euro vs US Dollar”

Euro is trying to continue its descending movement, which it started last week. The price has broken the 4/8level, and if later bears are able to stay below the 3/8 level, the market may continue falling towards the 1/8one.


As we can see at the H1 chart, after breaking the 0/8 level, the pair is trying to stay inside “oversold zone”. During a local correction last Friday, I opened an additional sell order. In the future, the price may break the-2/8 level. In this case, the lines at the chart will be redrawn.

Forex Technical Analysis 03.03.2015 (EUR/USD, GBP/USD, USD/CHF, USD/JPY, AUD/USD, USD/RUB, GOLD)

Analysis for March 3rd, 2015

EUR USD, “Euro vs US Dollar”

Eurodollar is still consolidating. The main scenario for today remains the same – the price is expected to continue falling; the main target is at level of 1.1000. An alternative scenario implies that the market may try to expand this consolidation channel upwards to return to level of 1.1280 and then continue moving inside the downtrend.


GBP USD, “Great Britain Pound vs US Dollar”

Pound has broken its consolidation channel downwards and may continue falling to reach level of 1.5280. After that, the pair may return to level of 1.5370.

The Australian dollar is in good spirits

On Tuesday morning, the AUD/USD is trading with an increase in response to comments from the Reserve Bank of Australia.

The Australian dollar is now growing in tandem with the US currency. At the regular meeting of the Reserve Bank of Australia the interest rate was left unchanged at 2.25% per annum; although projections suggest that the regulator will reduce it to 2.00%, since it started a series of mitigations.

In the comments, the RBA noted that for now it is appropriate to leave the rates on the same level as a reduction in energy costs will put pressure on inflation in the country. At the same time, cheaper oil and gas will enable production to raise its head.

Ichimoku Cloud Analysis 03.03.2015 (GBP/USD, GOLD)

Analysis for March 3rd, 2015

GBP USD, “Great Britain Pound vs US Dollar”

GBP USD, Time Frame H4. Tenkan-Sen and Kijun-Sen formed “Dead Cross” (1) above Kumo Cloud; Tenkan-Sen and Senkou Span A are directed downwards. Chinkou Lagging Span is below the chart, and Ichimoku Cloud is going down (2). Short-term forecast: we can expect support from Senkou Span A, resistance from Tenkan-Sen, and attempts of the price to stay below the cloud.


GBP USD, Time Frame H1. Indicator signals: Tenkan-Sen and Kijun-Sen are influenced by “Dead Cross” (1). Chinkou Lagging Span is below the chart, Ichimoku Cloud is heading down (2), and the price is below the lines. Short-term forecast: we can expect resistance from Senkou Span A, and decline of the price.

Wave Analysis 03.03.2015 (EUR/USD, GBP/USD, USD/JPY, USD/CAD)

Analysis for March 3rd, 2015

EUR USD, “Euro vs US Dollar”

Euro is still forming an impulse inside a large descending wave (v) of [iii]. Most likely, in the nearest future, the market may continue falling and stay below 1.1100.


Probably, the pair has already completed a correctional wave ii of (v) of [iii] in the form of running flat. In the nearest future, the market is expected to move downwards and stay below the confirming level at 1.1158.

Japanese Candlesticks Analysis 03.03.2015 (EUR/USD, USD/JPY)

Analysis for March 3rd, 2015

EUR USD, “Euro vs. US Dollar”

The H4 chart of EUR USD shows a sideways correction within the downtrend. Three Line Break chart indicates the downtrend; Heiken Ashi candlesticks confirm that the correction continues.


As we can see at the H1 chart of EUR USD, the price has been supported by the lower Window. Three Line Break chart and Heiken Ashi candlesticks indicate that an ascending correction continues.

Monday 2 March 2015

The Yuan retreated to a two-year low

After the announcement of the People's Bank of China on the lowering of the basic interest rate on loans and deposits, the local Yuan currency tested a two-year "minimum".

On March 1, 2015 the People's Bank of China decided to lower the benchmark interest rate on loans and deposits in Yuan to 2.5% that is, by 25 basis points. This was announced last night but yesterday was inoperative, so capital markets sell this information in quotes just now.

Among other things, the lending rate to financial institutions for 12 months has been revised downward by 25 basis points. Now it is 5.35%.

This decision means that the PBC is softening the monetary policy due to external and internal economic conditions. Apparently, it's time to create a kind of "soft" fundamentals of the economy, which will help "soften the blow" when necessary.

Fibonacci Retracements Analysis 02.03.2015 (EUR/USD, EUR/GBP)

Analysis for March 2nd, 2015

EUR USD, “Euro vs US Dollar”

After rebounding from the upper fibo-levels several times, Eurodollar resumed falling. The closest target for bears is the group of fibo-levels at 1.0940. I’m planning to stop trading after the pair reaches the above-mentioned area.


At the H1 chart, the pair is still being corrected. Earlier I opened an additional sell order and moved the stop losses on my previous ones a bit lower. Possibly, the current correction may complete at a local retracement 38.2%. After that, the market may start a new descending movement.

Murrey Math Lines 02.03.2015 (EUR/USD, AUD/USD)

Analysis for March 2nd, 2015

EUR USD, “Euro vs US Dollar”

Euro is trying to continue its descending movement, which it started last week. The price has broken the 4/8level, and if later bears are able to stay below the 3/8 level, the market may continue falling towards the 1/8one.


As we can see at the H1 chart, after breaking the 0/8 level, the pair is trying to stay inside “oversold zone”. During a local correction last Friday, I opened an additional sell order. In the future, the price may break the-2/8 level. In this case, the lines at the chart will be redrawn.

Ichimoku Cloud Analysis 02.03.2015 (GBP/USD, GOLD)

Analysis for March 2nd, 2015

GBP USD, “Great Britain Pound vs US Dollar”

GBP USD, Time Frame H4. Indicator signals: Tenkan-Sen and Kijun-Sen formed “Dead Cross” (1) above Kumo Cloud. Chinkou Lagging Span is on the chart, and Ichimoku Cloud is closed (2). Short-term forecast: we can expect resistance from Kijun-Sen, and attempts of the price to stay below the cloud.


GBP USD, Time Frame H1. Indicator signals: Tenkan-Sen and Kijun-Sen formed strong “Dead Cross” (1) below Kumo Cloud. Chinkou Lagging Span is on the chart, Ichimoku Cloud is heading down (2), and the price is between Tenkan-Sen and Kijun-Sen. Short-term forecast: we can expect resistance from Senkou Span A, and decline of the price.

Forex Technical Analysis 02.03.2015 (EUR/USD, GBP/USD, USD/CHF, USD/JPY, AUD/USD, USD/RUB, GOLD)

Analysis for March 2nd, 2015

EUR USD, “Euro vs US Dollar”

Eurodollar continues moving downwards; the market hasn’t been able to form a correction. After reaching new lows, the pair is expected to continue falling towards level of 1.1000.


GBP USD, “Great Britain Pound vs US Dollar”

Pound is consolidating. After leaving the channel downwards, the price may reach level of 1.5285. This descending movement may be considered a correctional one.

Wave Analysis 02.03.2015 (EUR/USD, GBP/USD, USD/JPY, USD/CAD)

Analysis for March 2nd, 2015

EUR USD, “Euro vs US Dollar”

After finishing horizontal triangle inside wave (iv) of [iii], Euro has formed the first five-wave structure of a larger descending impulse inside wave (v) of [iii]. Most likely, by now the market has completed only the first wave i of (v) of [iii], and at the moment the price is expected to start a correction.


After making a fast descending movement and leaving horizontal triangle inside wave i of (v) of [iii], the price is probably forming a correction inside wave ii of (v) of [iii], which may take the form of flat.

Japanese Candlesticks Analysis 02.03.2015 (EUR/USD, USD/JPY)

Analysis for March 2nd, 2015

EUR USD, “Euro vs. US Dollar”

At the H4 chart of EUR USD, Three Methods continuation pattern indicates that the downtrend may continue. Three Line Break chart and Heiken Ashi candlesticks confirm a descending movement.


As we can see at the H1 chart of EUR USD, Tweezers and Harami patterns have stopped an ascending correction, but the lower Window may provide support again. Three Line Break chart and Heiken Ashi candlesticks still indicate a descending movement.

Sunday 1 March 2015

Webinars during the next week

Monday 02 March
20:00Forecasting The Week Ahead
Dale Pinkert
Registration
Tuesday 03 March
11:00如何选择最佳投资资产
赵力
Registration
Wednesday 04 March
20:00Follow up Analysis
Dale Pinkert
Registration

"Bonus March" – deposit bonus up to 85%

Dear Clients and Partners!
RoboForex financial group is giving you a pleasant surprise in March. Deposit your trading accounts via VISA/MasterCard cards or China UnionPay from March 2nd to 31st 2015 and receive deposit bonus up to 85% of the deposited sum. Now you have an excellent opportunity to increase your trading volume and profit.

"Bonus March" offer is:

  • Bonus up to 85% of the deposited sum – just deposit the funds necessary for trading to your trading account and increase each your deposit by 85%.
  • The offer is valid for all ways of depositing available in your Live Account made via VISA/MasterCard cards or China UnionPay payment system.
  • The total amount of bonuses, which you can receive during the period of the offer, is up to 14 000 USD!
  • You can receive the bonus when you deposit any type of MetaTrader4 Fix and Pro accounts (the offer is not valid for ECN and CopyFX accounts).
You can read more about the offer on "«Bonus March» - deposit bonus up to 85%" page of our website.
Sincerely,
RoboForex
RoboForex is an international financial group. RoboTrade Ltd, an international regulated broker with "Trading in financial and commodity-based derivative instruments and other securities" license, is registered in International Financial Services Commission Belize. RoboForex (CY) Ltd, a European STP-broker regulated by the Cyprus Securities and Exchange Commission (CySEC), is an official member of the Cyprus Investor Compensation Fund (ICF).

The Japanese yen slightly rose against the USD

On Friday morning, the USD/JPY pair is falling after yesterday’s rally: most likely, this is purely a technical pullback, as the flow of Japanese statistical data is too ambiguous.

The Japanese yen on Friday morning is moving up, although yesterday the yen literally "surrendered" in pairing with the USD. On Thursday evening the USD managed to rise sharply after the publication of the report on the volume of orders for durable goods in the US in January - for the first time in three months there was a strengthening of the indicator.

There was a lot of morning statistics on Japan today. Inflation in Japan fell again in January, which is a trend for the sixth month in a row. The consumer price index, at the beginning of the year amounted to 2.2% y/y vs. the forecast of 2.3% and the previous value of 2.5% y/y. In fact, the assessment of price dynamics is deteriorating, although the Bank of Japan has not commented on this trend.

The euro fell to a February minimum

On the last trading day of winter, the main currency pair is attempting to recover from yesterday's failure.

On Friday, the euro is trying to recover some positions. The night before, the euro/dollar came under pressure after the release of a significant block of American statistics.

Published data has shown that the volume of orders for durable goods in the US in January rose by 2.8% after a fall in December by 3.7%. The median forecast assumed that the rate may strengthen by 1.7%. This data is positive: growth in the indicator is seen for the first time in three months, and even if there is a correction to the previous value, the increase in the index stabilized the US dollar.

Fibonacci Retracements Analysis 27.02.2015 (EUR/USD, EUR/GBP)

Analysis for February 27th, 2015

EUR USD, “Euro vs US Dollar”

After rebounding from the upper fibo-levels several times, Eurodollar resumed falling. The closest target for bears is the group of fibo-levels at 1.0940. I’m planning to stop trading after the pair reaches the above-mentioned area.


At the H1 chart, the pair has reached the intermediate target is the group of fibo-levels at 1.1180 and started a correction. I’ve opened an additional sell order and moved the stop losses on my previous ones a bit lower. Possibly, the current correction may complete at a local retracement 38.2%.

Murrey Math Lines 27.02.2015 (EUR/USD, USD/CAD, NZD/JPY)

Analysis for February 27th, 2015

EUR USD, “Euro vs US Dollar”

Euro has left its month-long consolidation channel by making a fast descending movement. The price has broken the 4/8 level, and if later bears are able to stay below the 3/8 level, the market may continue falling towards the 1/8 one.


As we can see at the H1 chart, after breaking the 0/8 level, the pair is trying to stay inside “oversold zone”. During a local correction, I opened an additional sell order. In the future, the price may break the -2/8 level. In this case, the lines at the chart will be redrawn.

Wave Analysis 27.02.2015 (EUR/USD, GBP/USD, USD/JPY, USD/CAD)

Analysis for February 27th, 2015

EUR USD, “Euro vs US Dollar”

So, on Thursday Euro left triangle downwards, just as we expected. Most likely, right now the pair is forming wave i of (v) of [iii] of a larger descending impulse. In the nearest future, after finishing a local correction inside wave ii of (v) of [iii], the price s expected to continue falling inside wave iii of (v) of [iii].


The structure of horizontal triangle inside wave (iv) of [iii] has changed a bit – most likely, wave e of (iv) was finished in the form of horizontal triangle as well. So, in the nearest future,

Japanese Candlesticks Analysis 27.02.2015 (EUR/USD, USD/JPY)

Analysis for February 27th, 2015

EUR USD, “Euro vs. US Dollar”

At the H4 chart of EUR USD, after forming Shooting Star and Tweezers patterns, the price resumed falling. The pair has reached the closest Window and if the market is able to stay below it, the pair may continue moving downwards. In general, Three Line Break chart and Heiken Ashi candlesticks indicate a descending tendency.


As we can see at the H1 chart of EUR USD, after completing Evening Star pattern, the pair fell very fast and formed Three Black Crows pattern. If the price forms any bearish patterns during the correction, it may resume falling, which is confirmed by a descending movement indicated by Three Line Break chart.

Forex Technical Analysis 27.02.2015 (EUR/USD, GBP/USD, USD/CHF, USD/JPY, AUD/USD, USD/RUB, GOLD)

Analysis for February 27th, 2015

EUR USD, “Euro vs US Dollar”

Eurodollar has reached its downside targets. We think, today the price may form an ascending structure to return to level of 1.1380. After that, the pair may form a consolidation channel. If the market breaks this channel upwards, it may continue growing to reach level of 1.1530; if downwards – fall to reach level of 1.1000.


GBP USD, “Great Britain Pound vs US Dollar”

Thursday 26 February 2015

The euro is stable on Thursday morning

The main currency pair is trading at a fairly neutral level, although investors have reasons to be nervous - for example, during the speech by Fed Yellen.

The euro/dollar remains within the medium-term trading range. The main trades in the instrument now extend around the 1.1365 mark, and this is a good achievement for the European currency.

Yesterday’s speech by the head of the Federal

Fibonacci Retracements Analysis 26.02.2015 (EUR/USD, EUR/GBP)

Analysis for February 26th, 2015

EUR USD, “Euro vs US Dollar”

After rebounding from the upper fibo-levels, Eurodollar is trying to resume falling. The closest target for bears is the group of fibo-levels at 1.0940. I’m planning to stop trading after the pair reaches the above-mentioned area.


At the H1 chart, the pair is attempting to rebound from a local retracement 61.8%. The intermediate target is the group of fibo-levels at 1.1180. Possibly, later the pair may start a new short-term correction from the lower levels.

Japanese Candlesticks Analysis 26.02.2015 (EUR/USD, USD/JPY)

Analysis for February 26th, 2015

EUR USD, “Euro vs. US Dollar”

At the H4 chart of EUR USD, the price has formed Shooting Star and triple Tweezers patterns near the Moving Average, which means that a descending movement may continue. Three Line Break chart and Heiken Ashi candlesticks indicate a short-term correction.


As we can see at the H1 chart of EUR USD, the price has formed Evening Star pattern. Later, the pair may fall towards the lower Window and even break it, which is confirmed by a descending movement indicated by Three Line Break chart.

Murrey Math Lines 26.02.2015 (EUR/USD, EUR/GBP, GBP/JPY)

Analysis for February 26th, 2015

EUR USD, “Euro vs US Dollar”

Euro is still being corrected and supported by Super Trends. The closest target is at the 2/8 level. If the market breaks it, it may continue falling and reach the 1/8 level or the 0/8 one. Later, after the price breaks the minimum, I’m planning to move my stop losses after the market.


The pair is moving in the middle of the H1 chart. Earlier, the market rebounded from the 7/8 level three times, which means that it may resume falling. Super Trends are still influenced by “bearish cross”. I’m planning to increase my short position as soon as the pair is able to stay below the 3/8 level.

Forex Technical Analysis 26.02.2015 (EUR/USD, GBP/USD, USD/CHF, USD/JPY, AUD/USD, USD/RUB, GOLD)

Analysis for February 26th, 2015

EUR USD, “Euro vs US Dollar”

Eurodollar is moving inside its consolidation channel. Possibly, the market may test level of 1.1400. After that, according to the main scenario, the price may fall towards level of 1.1240 and then return to level of 1.1380, thus continuing forming this consolidation channel.


GBP USD, “Great Britain Pound vs US Dollar”

Pound is extending its ascending structure. We think, today the price may reach level of 1.5600. this ascending movement may be considered only as an alternative. The main scenario implies that the downtrend is going to continue. The target is at level of 1.4850.

Wave Analysis 26.02.2015 (EUR/USD, GBP/USD, USD/JPY, USD/CAD)

Analysis for February 26th, 2015

EUR USD, “Euro vs US Dollar”

In case of Euro, the situation isn’t changing. Probably, the price has completed horizontal triangle inside wave (iv) of [iii] and right now is expected to start a strong descending movement inside wave (v) of [iii].


The pair has completed impulse i of (v) of [iii] and the correction inside wave ii of (v) of [iii]. In the nearest future, the price is expected to stay below the confirming level at 1.1287 and then start a new descending movement.

Wednesday 25 February 2015

The Australian dollar is trying to grow

By midweek, the AUD/USD pair has strengthened fairly well, based on the published statistics.

According to the statistics presented this morning, the volume of completed construction in Australia at the end of the fourth quarter of last year fell by 1.6%, but with the seasonally adjusted the indicator "dipped" only 0.2%. This is good information: the forecast assumed a more significant decline, of 1.2%. At the same time, the statistics for the third quarter was revised to fall to -2.8% from -2.2% before.

This release is very important: on the basis of it, one can analyze the condition of the entire construction sector in the country. In that case, if the indicator is growing, a local currency growth phase also begins.

And this is what happened with the AUD/USD pair.

Fibonacci Retracements Analysis 25.02.2015 (EUR/USD, EUR/GBP

Analysis for February 25th, 2015

EUR USD, “Euro vs US Dollar”

After rebounding from the upper fibo-levels, Eurodollar is trying to resume falling. The closest target for bears is the group of fibo-levels at 1.0940. I’m planning to stop trading after the pair reaches the above-mentioned area.


At the H1 chart, the pair has rebounded from a correctional retracement 61.8% four times and resumed moving downwards. The intermediate target is the group of fibo-levels at 1.1180. Possibly, later the pair may start a new short-term correction from the lower levels.

Japanese Candlesticks Analysis 25.02.2015 (EUR/USD, USD/JPY)

Analysis for February 25th, 2015

EUR USD, “Euro vs. US Dollar”

At the H4 chart of EUR USD, the price has formed Shooting Star and triple Tweezers patterns near the Moving Average, which means that a descending movement may continue. Three Line Break chart and Heiken Ashi candlesticks indicate a short-term correction.


As we can see at the H1 chart of EUR USD, the price has formed Evening Star pattern. Later, the pair may fall towards the lower Window and even break it, which is confirmed by a descending movement indicated by Three Line Break chart and Heiken Ashi candlesticks.

Murrey Math Lines 25.02.2015 (EUR/USD, EUR/GBP, GBP/JPY)

Analysis for February 25th, 2015

EUR USD, “Euro vs US Dollar”

Euro is still being corrected and supported by Super Trends. The closest target is at the 2/8 level. If the market breaks it, it may continue falling and reach the 0/8 one. Later, after the price breaks the minimum, I’m planning to move my stop losses after the market.


As we can see at the H1 chart, the market has rebounded from the 7/8 level three times, which means that it may resume falling. Super Trends are still influenced by “bearish cross”. I’m planning to increase my short position as soon as the pair is able to stay below the 3/8 level.

Forex Technical Analysis 25.02.2015 (EUR/USD, GBP/USD, USD/CHF, USD/JPY, AUD/USD, USD/RUB, GOLD)

Analysis for February 25th, 2015

EUR USD, “Euro vs US Dollar”

Eurodollar is moving inside its consolidation channel. The most preferred scenario implies that the price may continue falling to reach level of 1.1240. After that, the pair may return to level of 1.1380.


GBP USD, “Great Britain Pound vs US Dollar”

Wave Analysis 25.02.2015 (EUR/USD, GBP/USD, USD/JPY, USD/CAD)

Analysis for February 25th, 2015

EUR USD, “Euro vs US Dollar”

Euro continues moving inside a narrow trading range. Probably, the price has completed horizontal triangleinside wave (iv) of [iii] and right now is forming first five-wave structures inside a larger wave (v) of [iii]. At the same time, the fact that the market doesn’t move downwards may result in an alternative scenario (colored in gray), which implies that the price may be still growing inside wave y of (iv) of a larger double zigzag. This alternative scenario may become the main one if the pair is able to stay above 1.1429.


Probably, the pair has completed impulse i of (v) of [iii] of a larger wave (v) of [iii].

Tuesday 24 February 2015

The euro is pressured by circumstances

The main currency pair in the last week of February remains under pressure: Greece has not decided what he would do with their debt, and the time is coming to do so.

The euro/dollar continues to decline. The week opened with sales amid the Greek nebula, where uncertainty as to the Athenian finances persists to the present day. This factor weighs on the euro more than it ever has.

Daily statistics was interesting. German GDP grew in the fourth quarter of 2014 by 0.7%. The main factor of the increase in the index was the support from local consumption. The population is ready to spend, and this will support the German economy for some time. However, it should not be counted on as serious long term support. According to the components of the report, net exports give 0.2% to the GDP, and consumption adds 0.5%.

Inflation in Germany remained moderate, and prices did not grow to the delight of the consumers. This leads customers to the stores. People's willingness to spend is a good signal.

The market would have played on the good German GDP in full, but alas - the shadow of the Greek tragedy is hanging over the euro zone and threatens even stronger. February 28 ends the official term of the third package of aid to Greece from the "troika" of creditors. New negotiations still have not happened: Athens wants a reprieve, but at the same time they want to spend and live in a big way. Europe would like the debts returned and to reduce market tensions.

RoboForex Analytical Department
 Subscribe  
Attention!
Forecasts presented in this section only reflect the author’s private opinion and should not be considered as guidance for trading. RoboForex LP bears no responsibility for trading results based on trading recommendations described in these analytical reviews.

Fibonacci Retracements Analysis 24.02.2015 (EUR/USD, EUR/GBP)

Analysis for February 24th, 2015

EUR USD, “Euro vs US Dollar”

After rebounding from the upper fibo-levels, Eurodollar is trying to resume falling. The closest target for bears is the group of fibo-levels at 1.0940. I’m planning to stop trading after the pair reaches the above-mentioned area.


At the H1 chart, the pair has rebounded from a correctional retracement 61.8% four times and started falling. The intermediate target is the group of fibo-levels at 1.1180. Possibly, later the pair may start a new short-term correction from the lower levels.

Japanese Candlesticks Analysis 24.02.2015 (EUR/USD, USD/JPY)

Analysis for February 24th, 2015

EUR USD, “Euro vs. US Dollar”

At the H4 chart of EUR USD, the price has formed Shooting Star and triple Tweezers patterns near the Moving Average, which means that a descending movement may continue. Three Line Break chart and Heiken Ashi candlesticks are also reversing downwards.


As we can see at the H1 chart of EUR USD, after finishing Shooting Star pattern, the price has formed bearish Three Black Crows pattern. In the near term, if the price is able to stay below the closest Window, it may continue falling, which is confirmed by a descending movement indicated by Three Line Break chart and Heiken Ashi candlesticks.

Murrey Math Lines 24.02.2015 (EUR/USD, USD/JPY, GBP/JPY)

Analysis for February 24th, 2015

EUR USD, “Euro vs US Dollar”

Euro is still being corrected below Super Trends. The closest target is at the 2/8 level. If the market breaks it, it may continue falling and reach the 0/8 one. Later, after the price breaks the minimum, I’m planning to move my stop losses after the market.


As we can see at the H1 chart, the market has rebounded from the 7/8 level three times, which means that it may resume falling. Earlier, Super Trends formed “bearish cross”. I’m planning to increase my short position as soon as the pair is able to stay below the 3/8 level.